
Mine have always been a bit functional, and I’m curious what more creative people have achieved.
Anyone fancy showing off what they’ve put together? Feel free to blank out personal information, obviously.
And on another note, I’m now moderating this sub. Hi!
Let me know if there is anything you’d like to see added to the sidebar, I’m aiming to update it over the next few days.
You must log in or # to comment.
Only my first page 😅
Got other pages for specific functions. Not room based. Media, heat pump, server stats, climate inside, energy prices and usage per fase, adaptive lighting…


I’d post mine but it’s just the default overview. I really should put some effort into making something good.
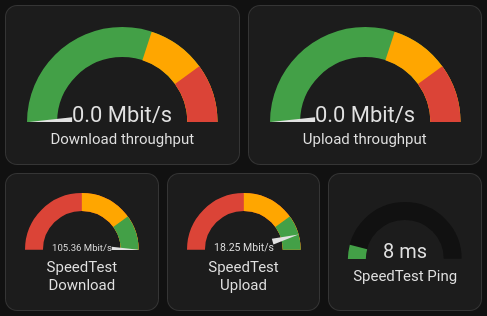
My “What’s the internet connection up to?” card:
My “Leaving the house” card:

It’s nice to compare the local predicted temperature, and local sensor.deleted by creator
Good news: The gauge card is a standard component.
It is indeed! Mostly just fiddling around with the settings.
@smeg@feddit.uk, here is a paste of the config so you can play with it:
(If you click show code editor, then paste in, you can then go back to visual editor with things configured)Speedtest needle gauges and ping with colour change:
type: horizontal-stack
cards:
  - type: gauge
    min: 0
    severity:
      green: 80
      yellow: 50
      red: 0
    entity: sensor.speedtest_download
    max: 100
    needle: true
  - type: gauge
    min: 0
    max: 20
    entity: sensor.speedtest_upload
    severity:
      green: 16
      yellow: 10
      red: 0
    needle: true
  - type: gauge
    min: 0
    entity: sensor.speedtest_ping
    severity:
      green: 0
      yellow: 15
      red: 20
    max: 100
Air quality with lots of different colours:
type: horizontal-stack
cards:
  - type: gauge
    entity: sensor.oxford_air_quality_index
    needle: false
    min: 0
    max: 500
    segments:
      - from: 0
        color: '#00e400'
      - from: 51
        color: '#ffff00'
      - from: 101
        color: '#ff7e00'
      - from: 151
        color: '#ff0000'
      - from: 201
        color: '#8f3f97'
      - from: 301
        color: '#800000'
    name: 'Air quality: PM2.5'
    unit: µg/m3
  - type: gauge
    entity: sensor.external_environment_f
    max: 40
    severity:
      green: 18
      yellow: 25
      red: 30
    needle: false
    min: -10
  - type: gauge
    entity: sensor.oxford_uv_index
    max: 10
    severity:
      green: 0
      yellow: 3
      red: 6
Once you’ve got your head around horizontal stacks (lets you put multiple small dials together), it’s mostly picking thresholds and settings colours.
I have this
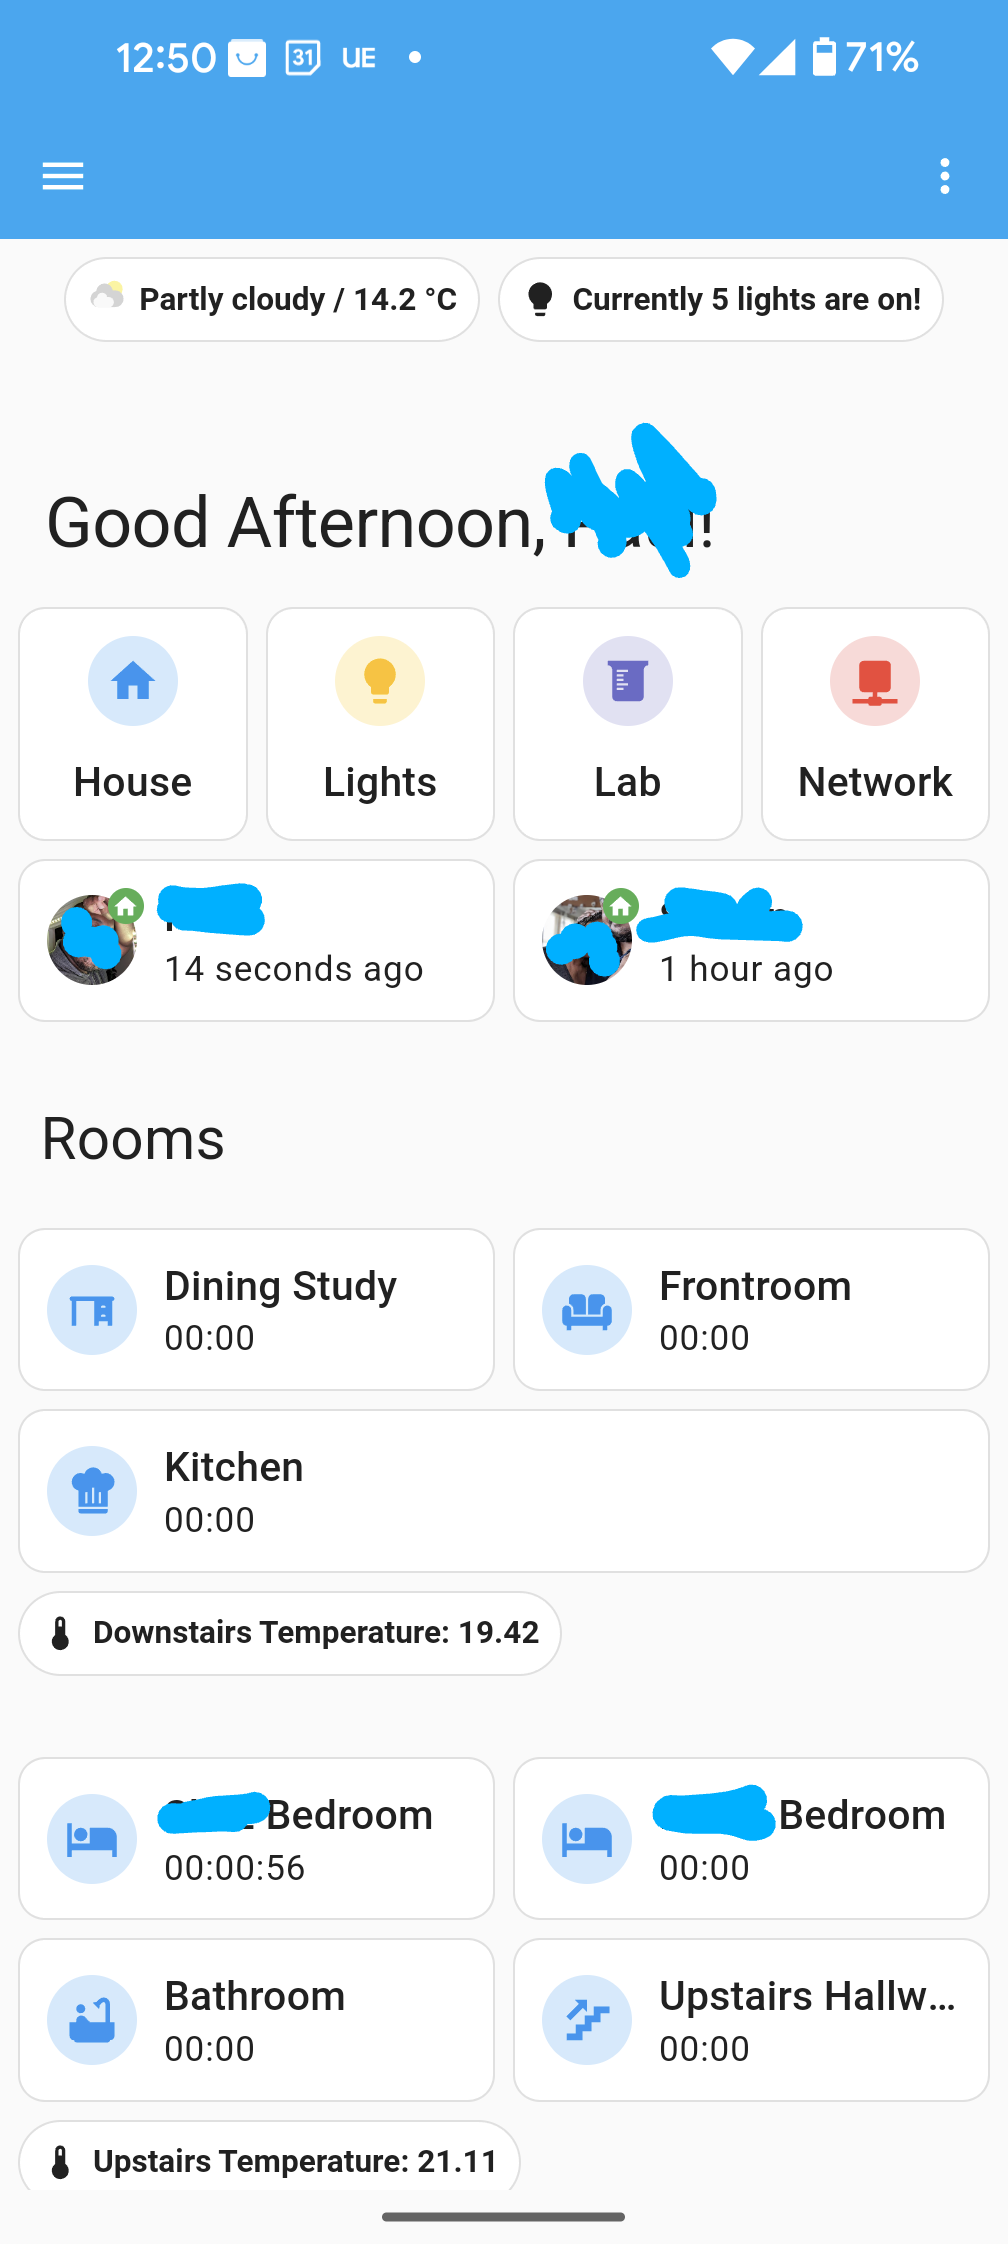
Are those shortcut buttons? How?m
It’s using Mushroom from HACS. I followed a tutorial: https://youtu.be/A0fMt8IRKoI
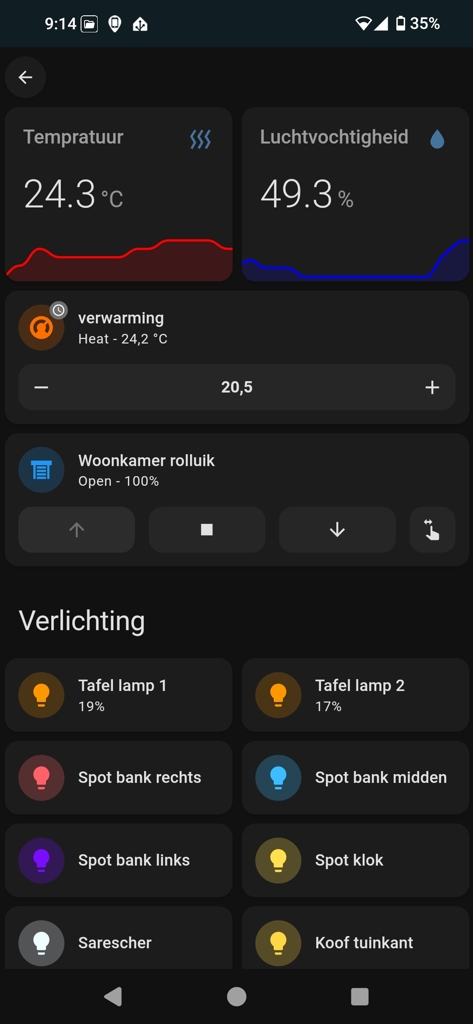
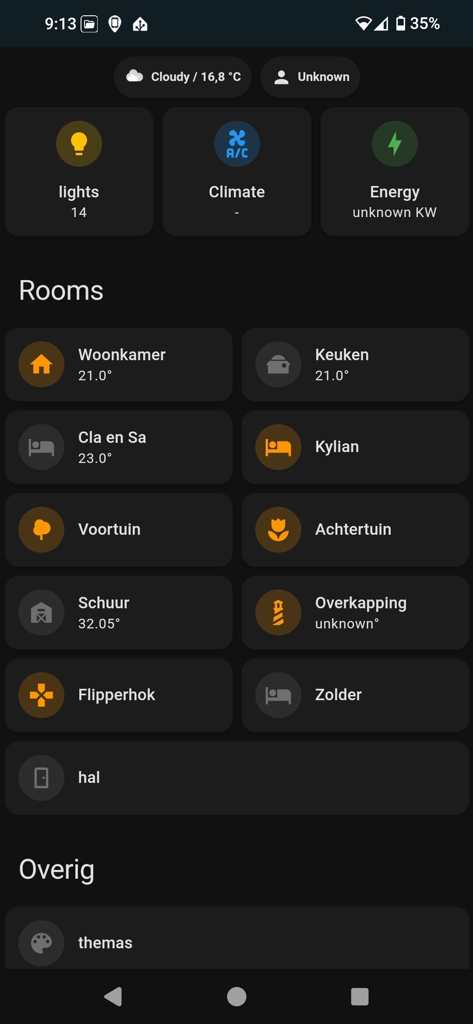
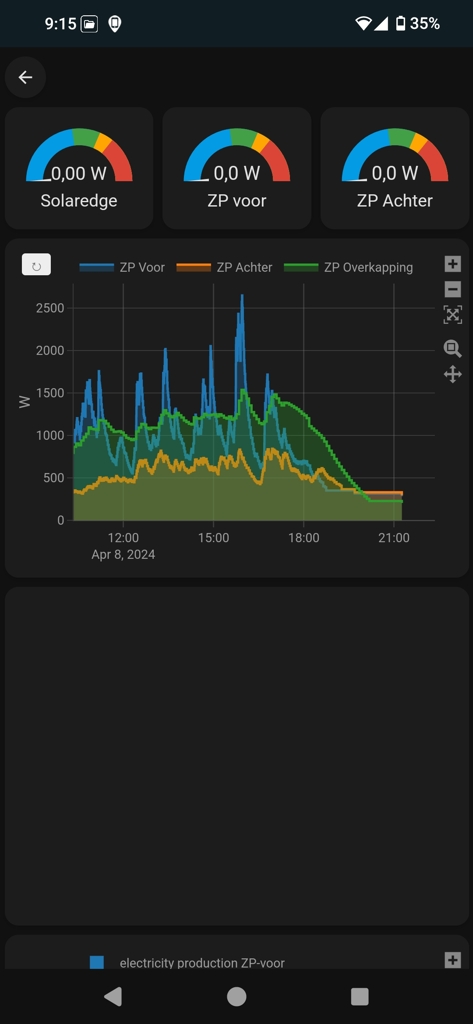
Each of the rooms has their own dashboard you can access by dubble clicking it, the energy Dashboard’s is still a wip.
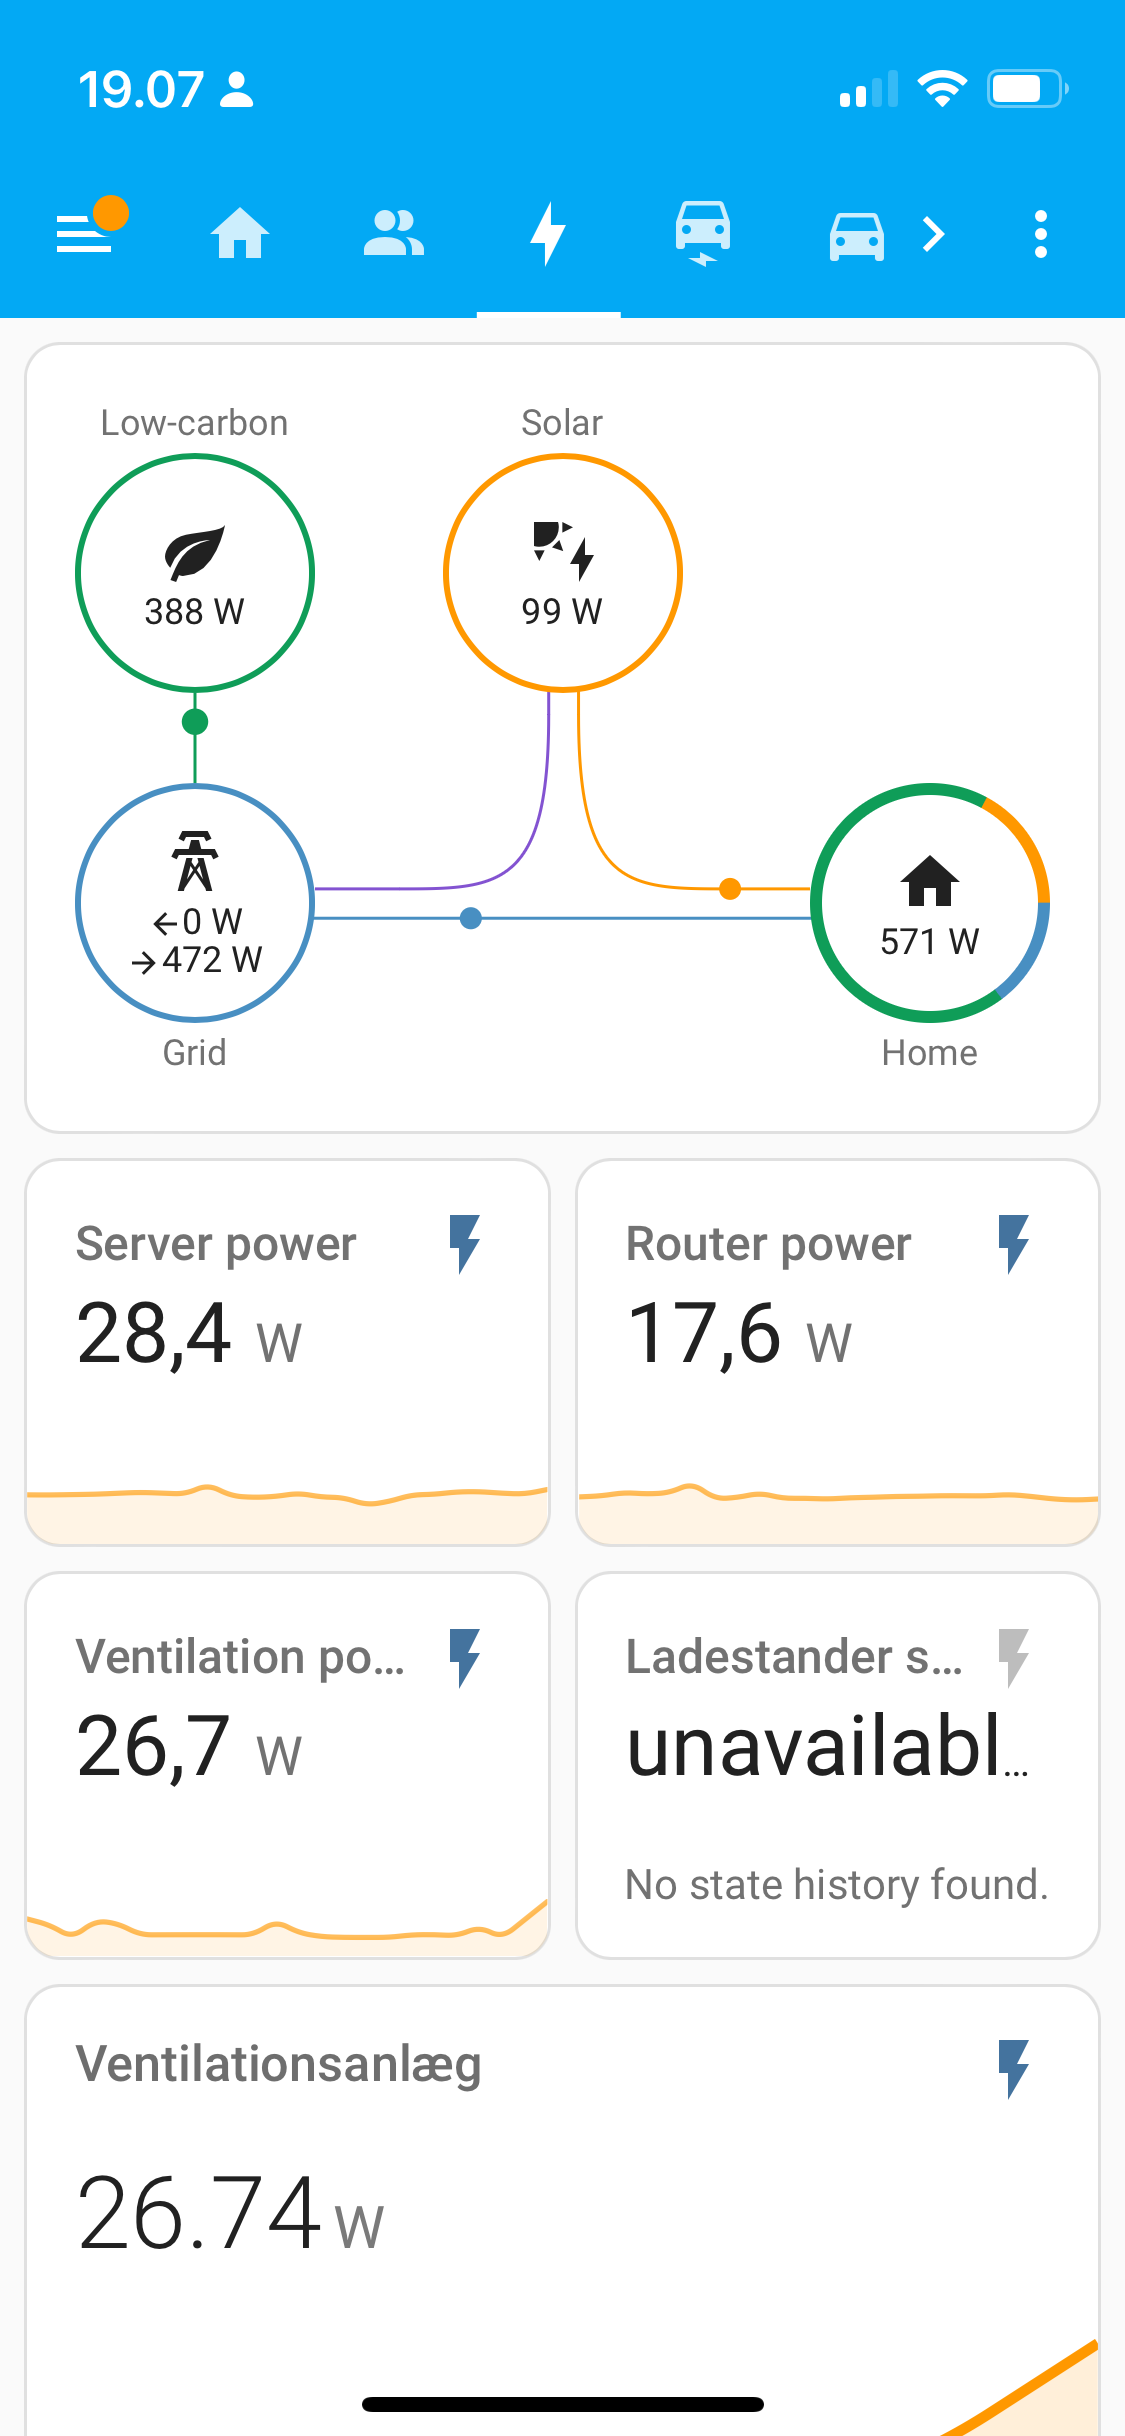
This is my “power usage page”
And my car card
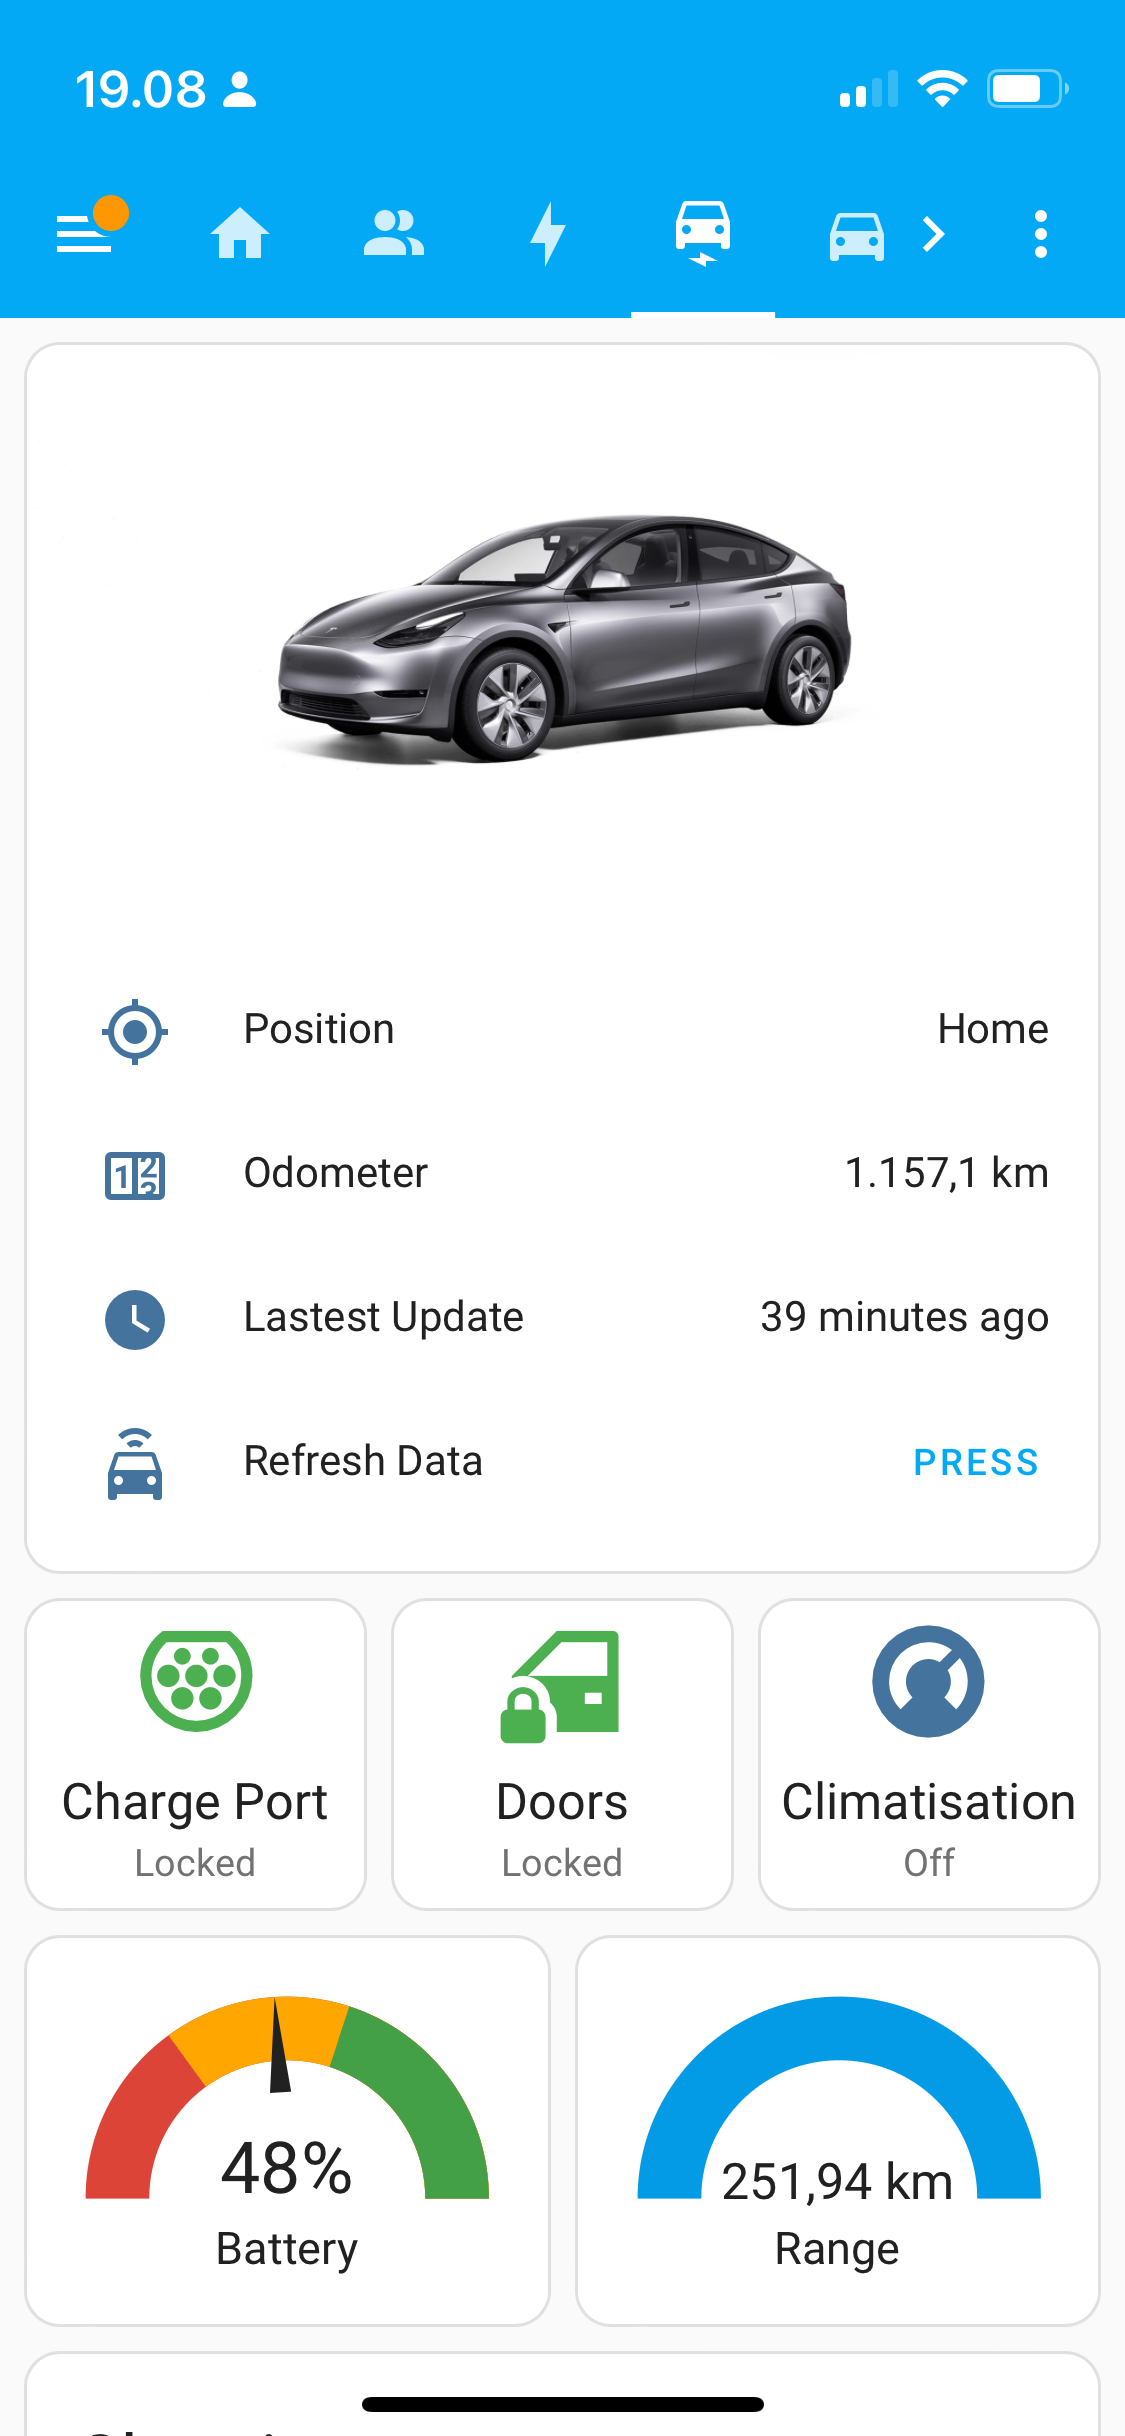
Still want to add a few bits of info to it, but I’m pretty happy with the dashboard for my kitchen display that sits on top of the fridge where I can see it from the living room as well:
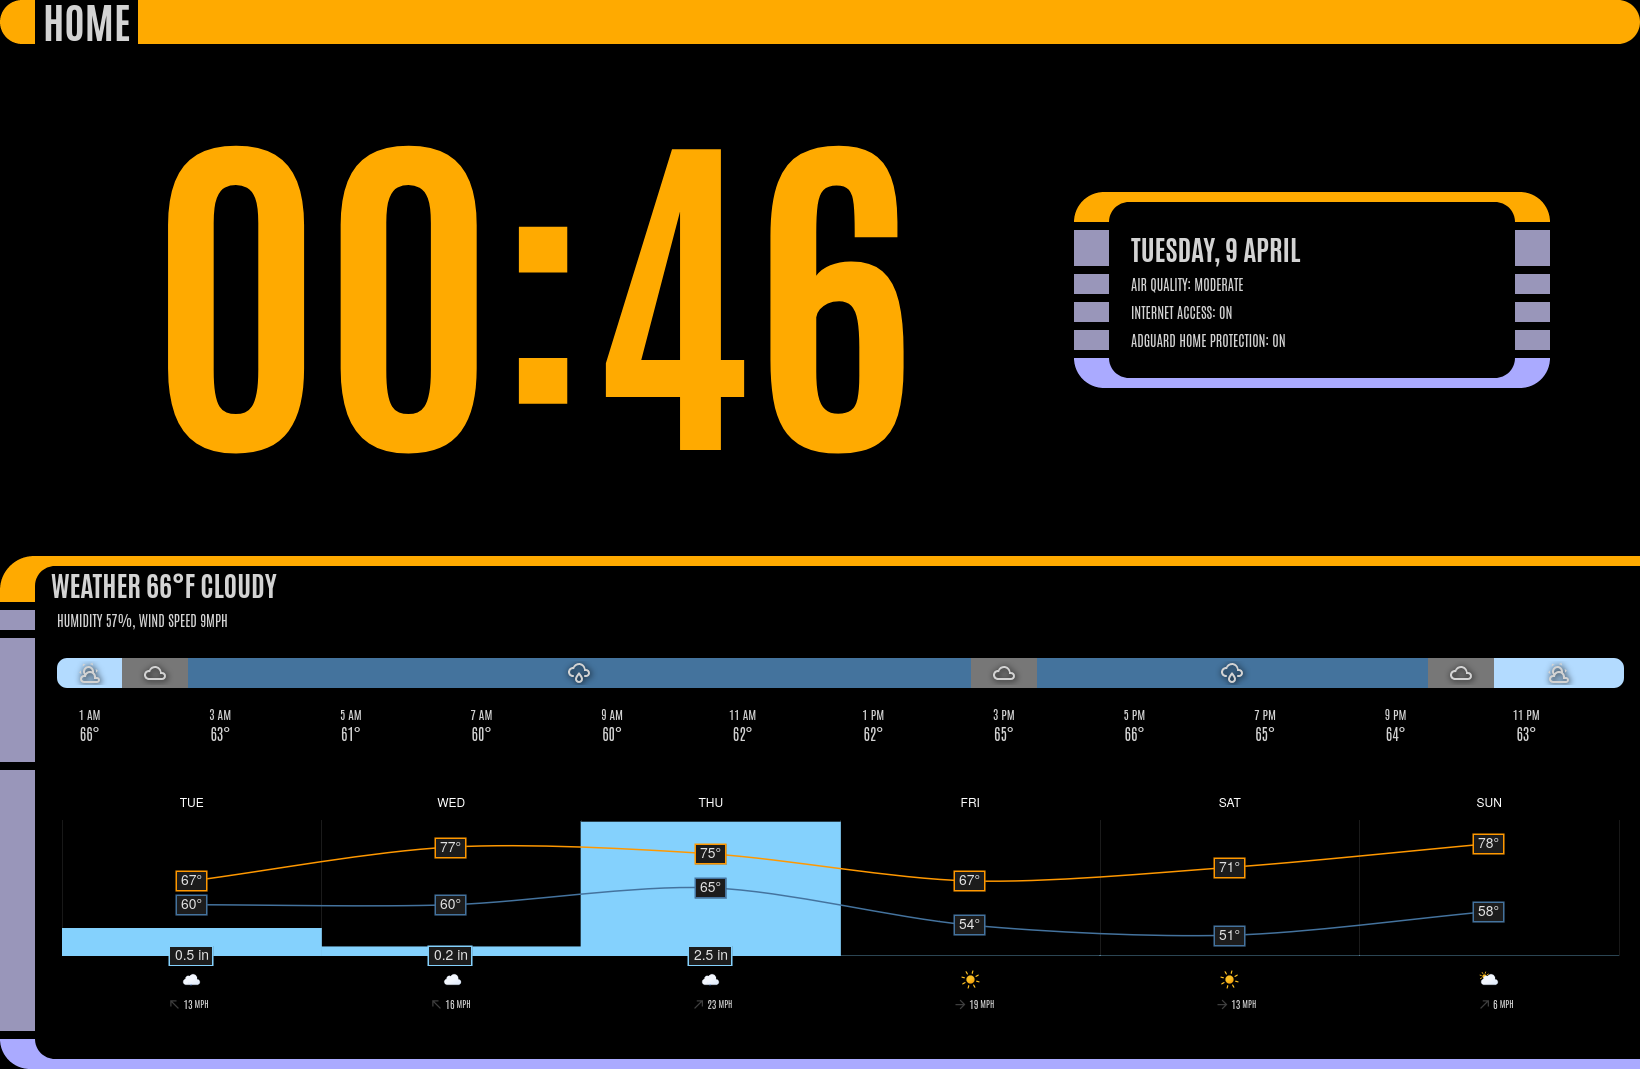
Uses the excellent LCARS theme by th3jesta via HACS.
Almost everything shown is just standard markdown cards, with minor tweaks by card-mod, with the exception of the 2 weather widgets shown (also via HACS):
My default dashboard is maybe a little bit unusual:
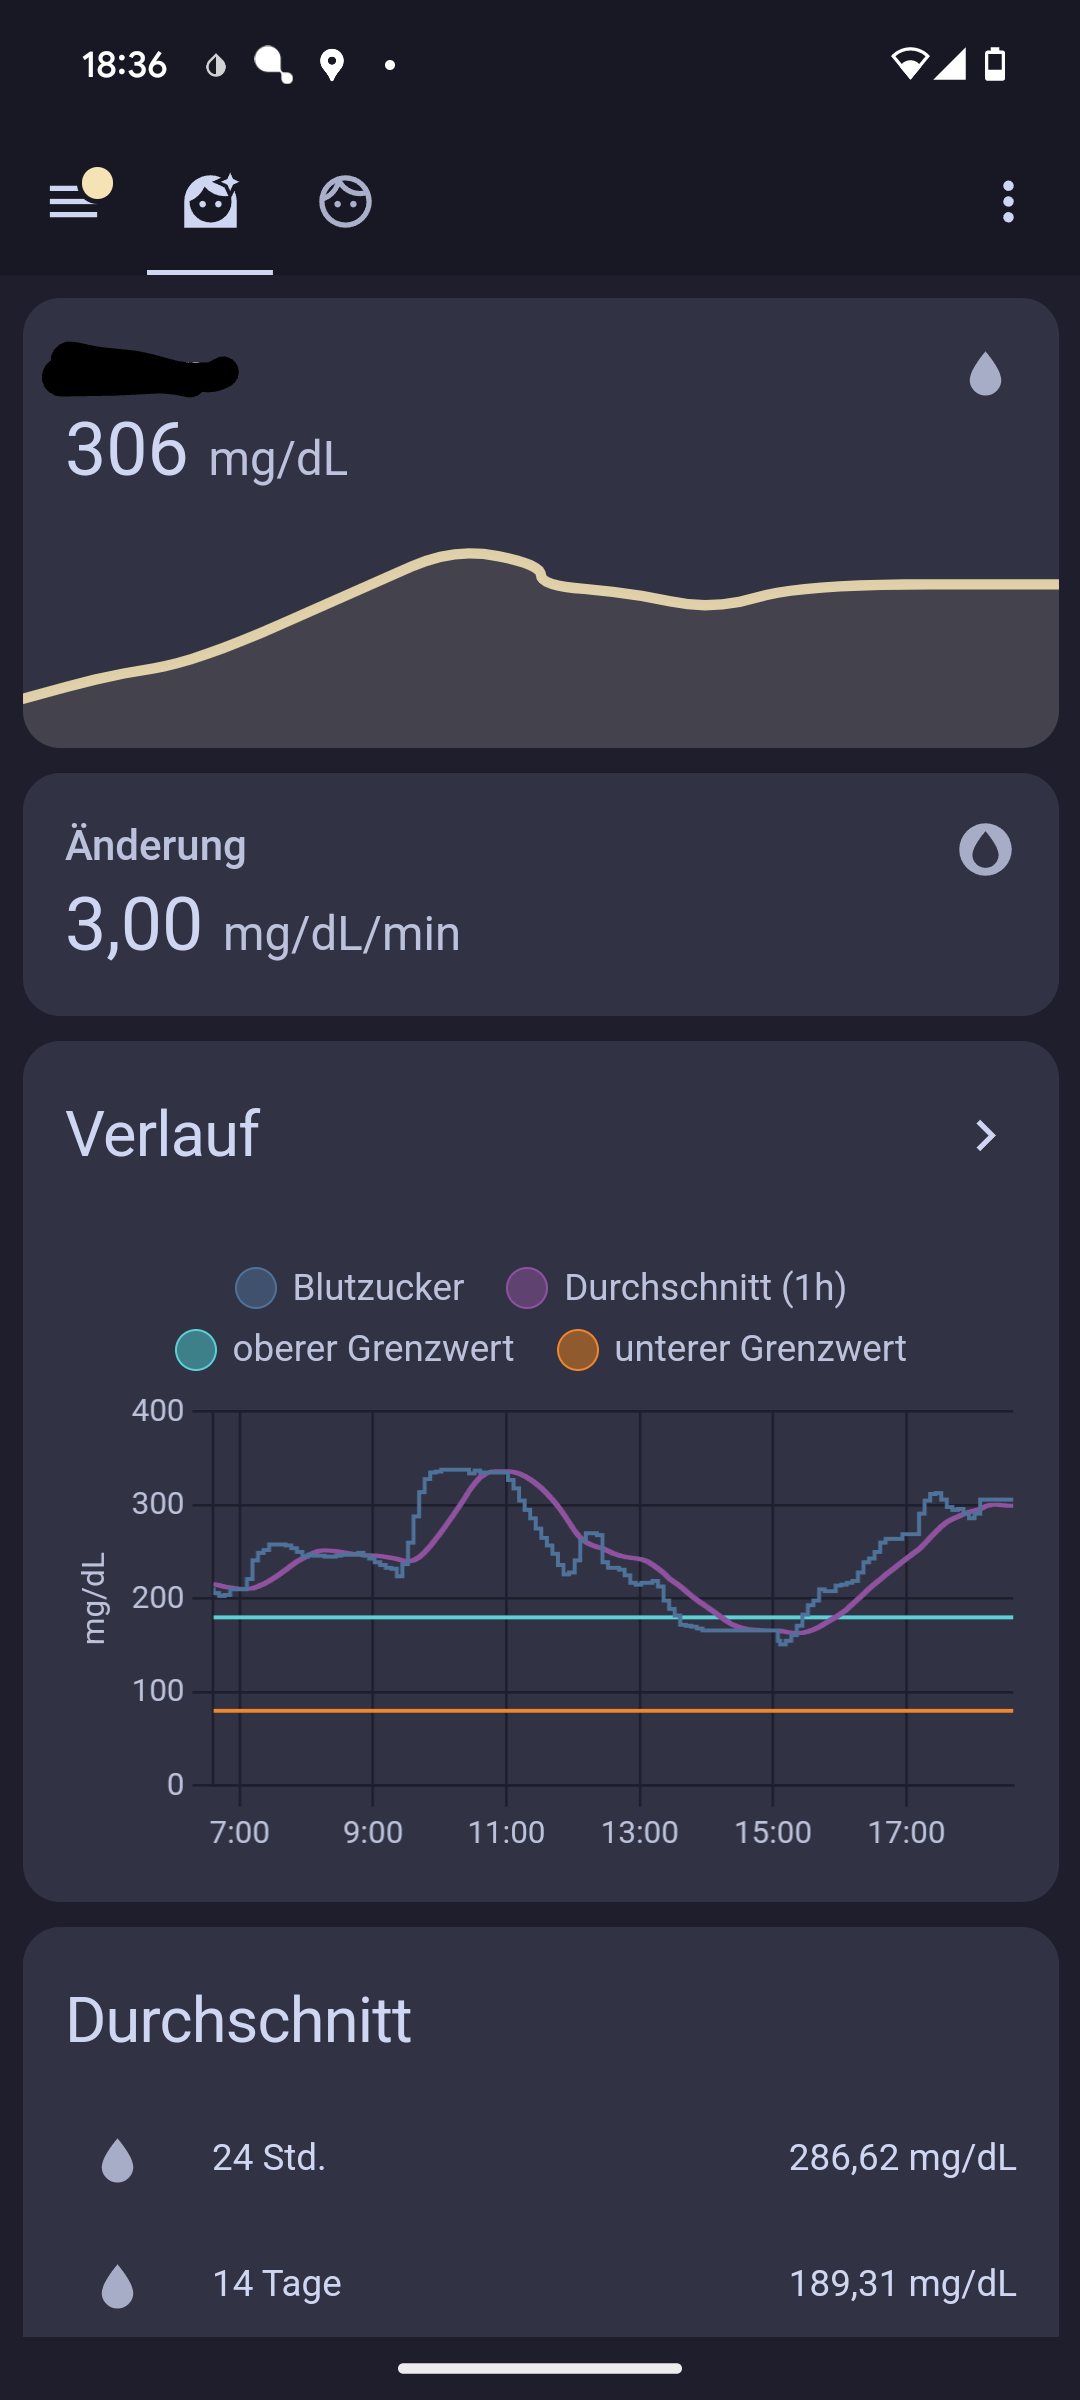
It’s the blood glucose levels of my daughter (and mine in the next tab) as we are both T1 diabetics. The levels are transmitted via a tool called Nightscout and then shared with Home Assistant. This allows my wife and myself to get notified via light signals at night (in addition to the alarm her blood glucose sensor sounds). The dashboard also contains average levels for several timespans as well as an estimated long time level (Hb1Ac).
The second dashboard is an overview of all the lights, sensors and appliances located on a floorplan of the house:
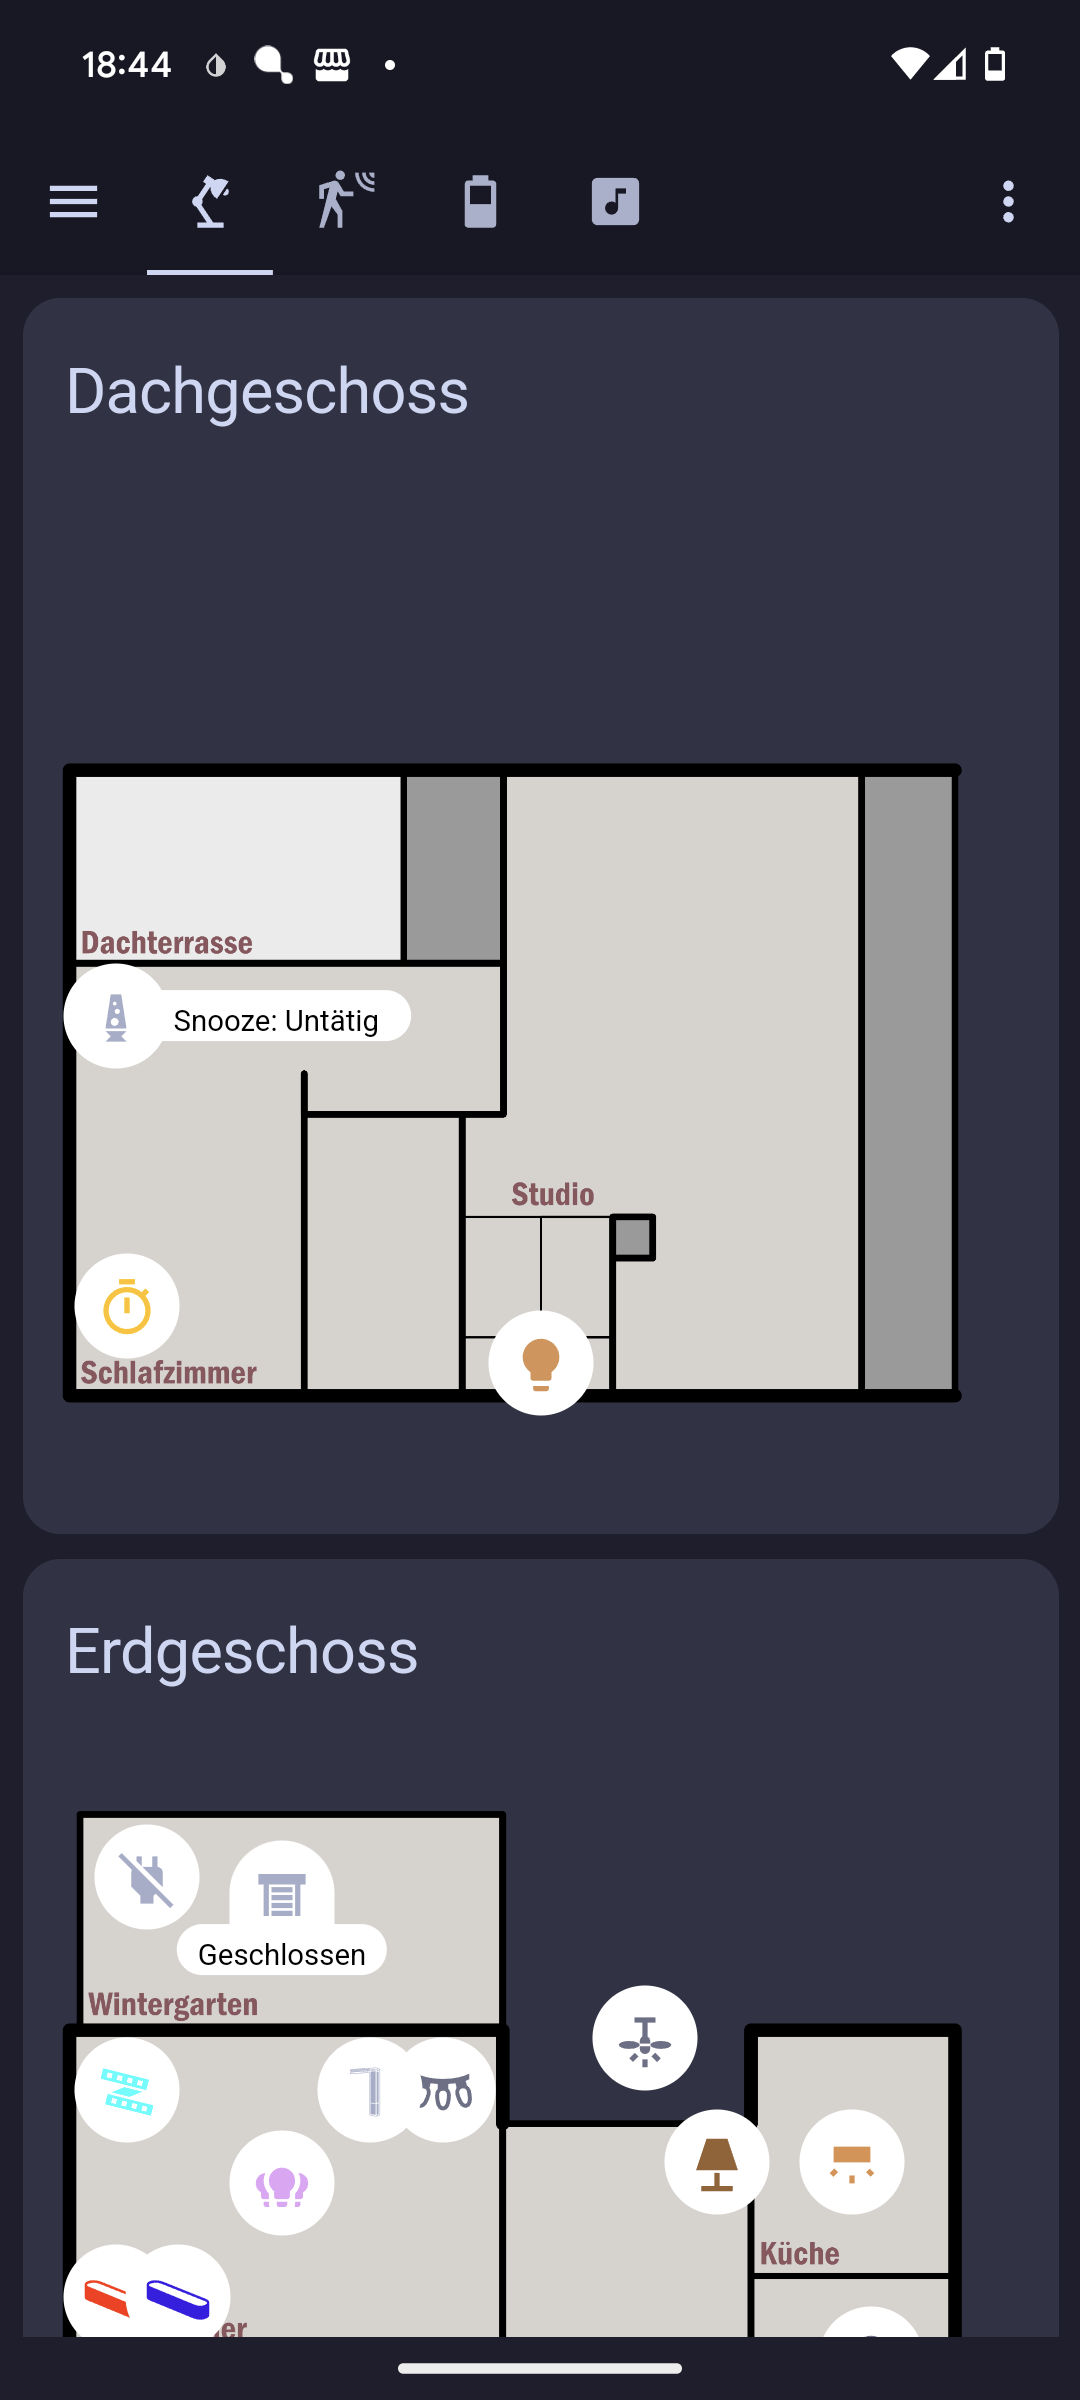
There are several tabs grouping lights (and appliances), sensor readings and battery levels.